
Logging
Introduction
Logging in DisplayNet involves the recording of both software and hardware events, occurrences, errors, statuses, and transactions both by the hardware infrastructure and the software application of your DisplayNet system.
Logging plays a crucial role in diagnosing issues, troubleshooting hardware or software failures which can be invaluable resources for integrators, software developers, and support teams in understanding system behavior, diagnosing faults, and optimizing performance.
To navigate to the Logging tab, click on the "Logging" sidebar option in the Tools Tab.
Logging Tab
The logging tab is located under the 'Tools Tab' and is used to view and search the logs of DisplayNet Manager. It is composed of three sections: Search Options, Query Results, and Output Options.
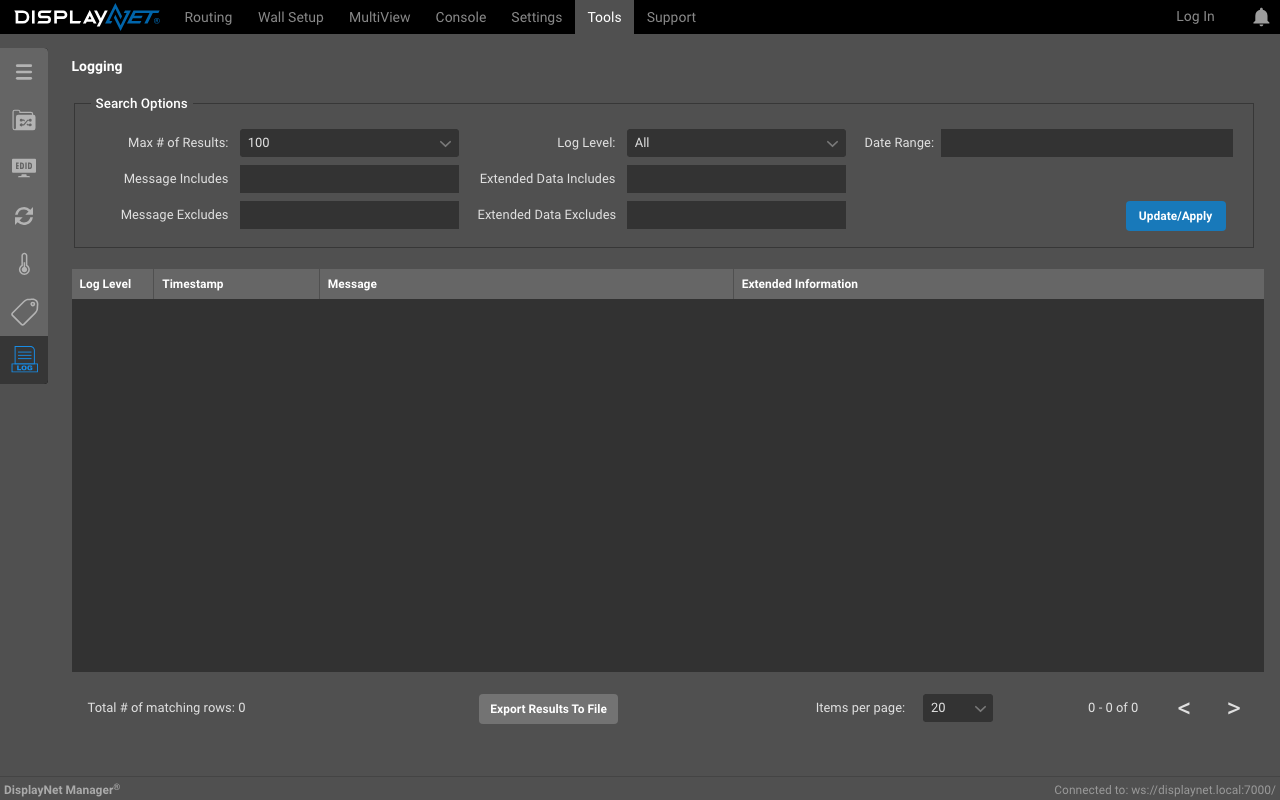
Search Options
The Search Options section is used to filter the logs based on the following criteria:
- messages that include or exclude specific text
- extended data that includes or excludes specific text
- date range
- log level
- maximum number of results
Log Levels
The log levels are used to filter the logs based on the severity of the message. The log levels are as follows:
- Debug
- Info
- Warning
- Error
- Verbose
- None
When one is selected, the logs will be filtered to only show messages at that level or higher. For example, if the log level is set to "Info", the logs will show all messages at the "Info" level and higher, but will not show messages at the "Debug" level.
Setting the Log Level
The Log Level that the DisplayNet API logs can be set in DisplayNet Manager by navigating to the Settings Tab and selecting the "Server" tab.
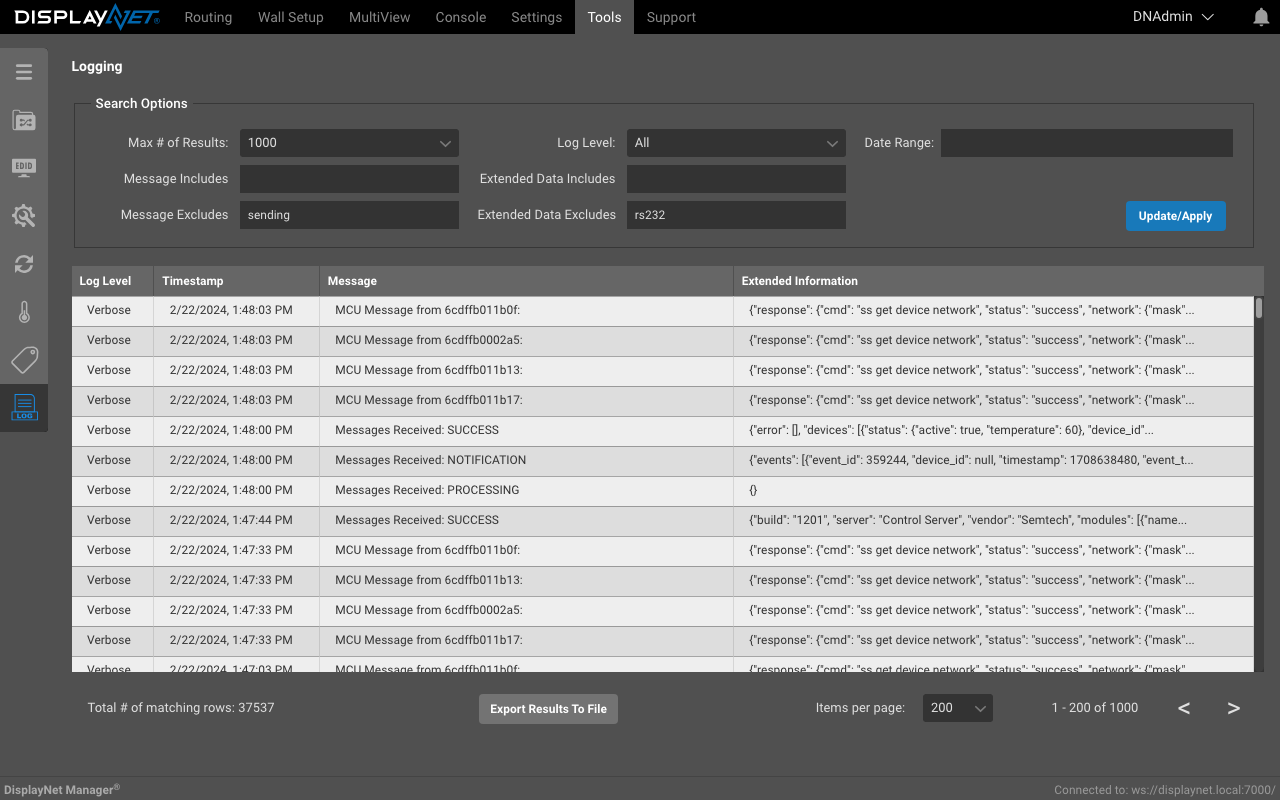
In this example, there were 1,000 rows that matched the search criteria, but only 1000 were returned because that was the maximum number of results set in the search options. The # of matching rows is the total number of rows that matched the search criteria. The items per page is the number of results that are shown on the page. The arrows on the bottom right of the page can be used to navigate between pages. The query excludes messages that contain the text "Received" and includes messages that have extended data that do not contain the text "RS232". Once the Search Options were set, the "Update/Apply" button was clicked to see the results.
When a row is clicked on, it is expanded to show the extended data details:
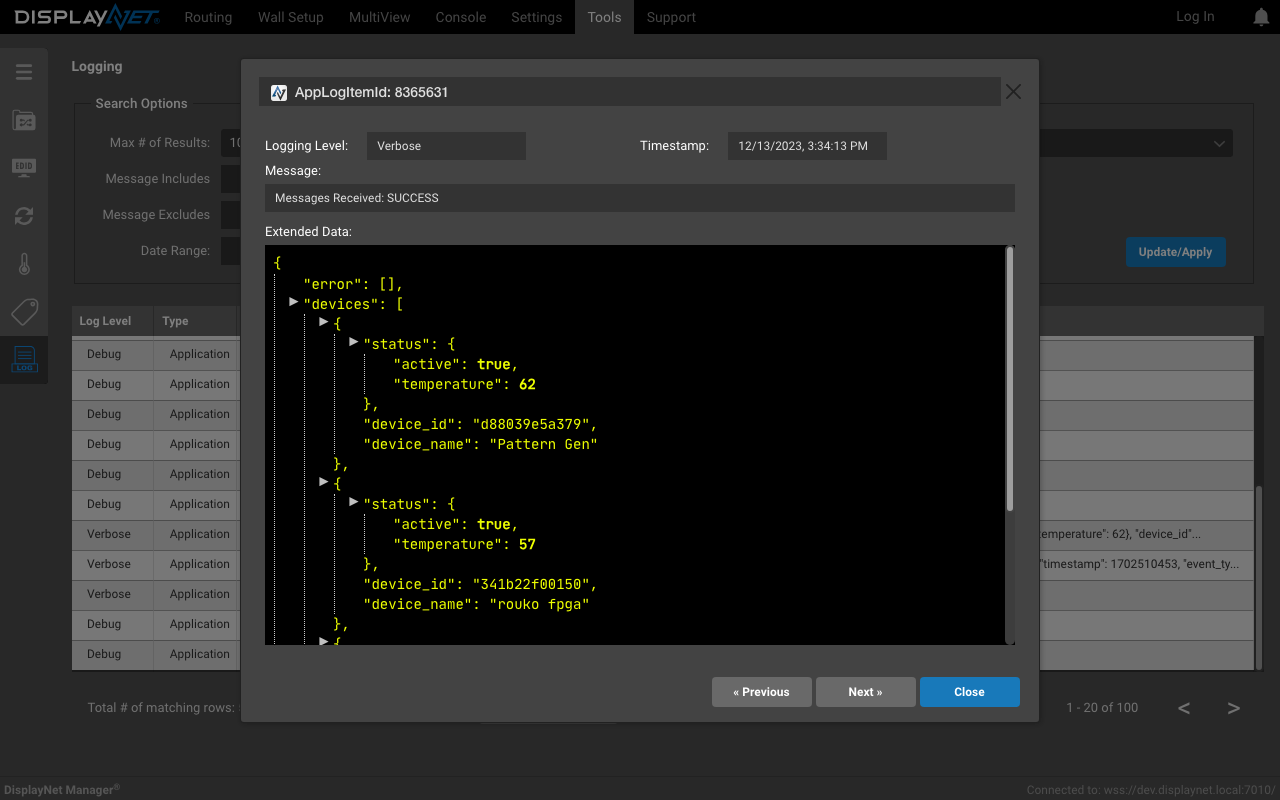
The Previous and Next buttons can be used to navigate between the log data in the current page of results.
Exporting query results to a file
You can export any results displayed in the Query Results section by simply clicking on the "Export Results To File" button. This file can then be forwarded to the support team to assist in troubleshooting any issues.